Bitcoin Price Today: Live USD Chart & Outlook
Bitcoin price today is the live USD spot value of BTC on major exchanges. Use the chart and checklist below for context—not as a buy button.
When traders search for the bitcoin price, they usually want two things at once: the latest USD print and a usable read on whether that print is noise or structure. Bitcoin price discovery happens across dozens of venues, yet most people still treat a single chart as “the” market. That shorthand works only if you know what the chart is measuring—spot versus futures, USD versus a stablecoin pair, and whether the candle includes an overnight gap or a continuous session.
This guide explains how to read bitcoin price today in USD terms, how to use a live chart without mistaking a snapshot for a live feed, and which market signals tend to matter more than a one-day percentage move. It is educational market literacy, not a buy or sell recommendation. Prices move continuously; any static number in an article will age within minutes.
What “bitcoin price” actually means
In plain language, the bitcoin price is the rate at which one bitcoin exchanges for another asset—most often U.S. dollars. In practice, there is no single official global price. Spot exchanges publish last-trade and mid-market quotes. Derivatives venues publish marks and index composites. Aggregators blend venue data with different weighting rules. That is why two reputable websites can disagree by tens or hundreds of dollars during fast markets.
For most readers tracking bitcoin usd levels, the cleanest reference is a major spot BTC-USD pair (or BTC-USDT when USD books are thin), viewed on a chart that clearly labels the venue. Futures marks are useful for leverage and funding context, but they are not identical to cash settlement. If your goal is “what would I pay to buy one bitcoin now,” prefer spot.
How to use a live USD chart without fooling yourself
A useful bitcoin price today workflow is simple and repeatable:
- Open a live BTCUSD chart and confirm the session (intraday, daily, weekly).
- Note the last print, the session high/low, and the prior week’s range.
- Separate headline volatility from structural change: a green candle after a Federal Reserve headline is often positioning, not a finished thesis.
- Check whether ETF flow headlines, exchange outflows, or macro surprises arrived in the same window.
Below is a TradingView snapshot for orientation. It is a frozen image from publish time and will not auto-update.
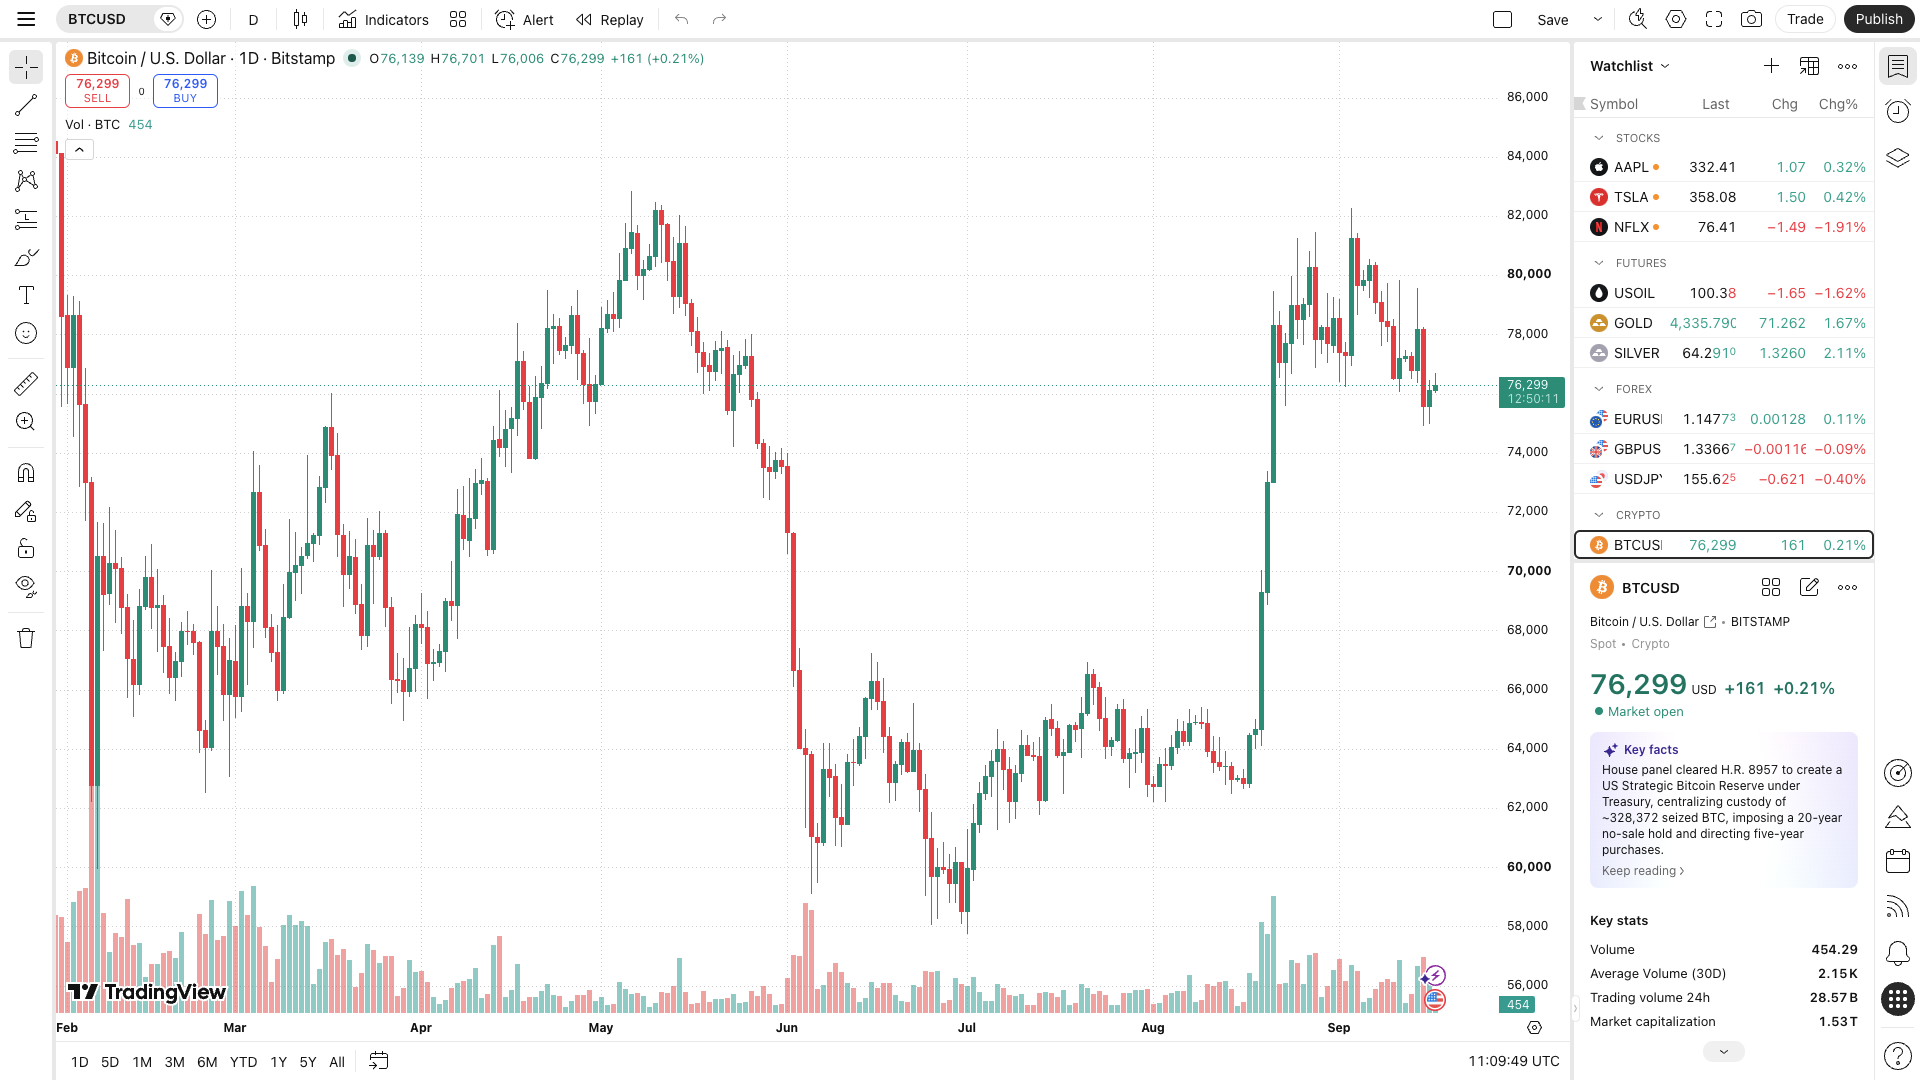
Snapshot for context only—open a live chart on TradingView BTCUSD for the current print.
Timeframes that actually help decision hygiene
Many newcomers over-weight the 24-hour percentage change because it is printed everywhere. That figure is mostly noise relative to weekly structure. A more durable habit is to ask three layered questions:
- Intraday: Is liquidity thin, and are spreads widening? Thin books exaggerate every headline.
- Weekly: Is price making higher highs and higher lows, or chopping inside a known range?
- Macro window: Did the move coincide with a policy surprise, a large ETF flow print, or a risk-off equity session?
None of those questions produces a guaranteed forecast. They reduce the chance that you narrate a random wick as destiny.
What usually moves bitcoin price in the short run
Short-horizon bitcoin price moves cluster around a few recurring catalysts:
Liquidity and risk appetite. When dollar funding conditions ease and investors seek risk, bitcoin often trades like a high-beta macro asset. When funding tightens, the opposite can happen—even if long-term adoption narratives are unchanged.
Policy surprises. Federal Reserve decisions, guidance language, and the market’s prior pricing of those outcomes matter more than the raw basis-point number. A cut that was fully expected can still produce a sell-the-news reaction.
Spot ETF and institutional flow headlines. Spot bitcoin ETFs changed how traditional capital expresses BTC exposure. Large creation/redemption days can become narrative fuel. Treat daily flow headlines as inputs, not as a permanent floor or ceiling.
Leverage flush. Crowded futures positioning, rising funding rates, and cascading liquidations can move price farther and faster than spot demand alone would imply. After a flush, the bitcoin price can look “irrational” relative to fundamentals for hours or days.
Venue and stablecoin stress. Exchange outages, withdrawal delays, or stablecoin depeg fears can temporarily disconnect bitcoin usd prints across venues. Always ask whether you are looking at a global move or a local dislocation.
How to avoid common chart misreads
Mistaking mark price for spot. Perpetual futures marks include funding and index construction. Useful for traders; less precise for “cash price of bitcoin.”
Treating one exchange as truth. Arbitrage usually keeps major venues close, but during stress the gap widens. If your chart and your broker disagree wildly, pause before acting.
Overfitting patterns. Drawing triangles after every move feels analytical; it often just renames randomness. Prefer ranges, prior highs/lows, and volume context over exotic pattern names.
Ignoring weekends and holidays. Crypto trades continuously, but traditional market calendars still shape liquidity. Thin holiday sessions can produce outsized percentage moves that reverse when full liquidity returns.
Confusing USD and local-currency narratives. Bitcoin can rise in a weak local currency while flat or down in USD. Clarify which quote you mean when you say “bitcoin is up.”
Building a calm market outlook (without fake certainty)
A market outlook for bitcoin price should be a map of scenarios, not a prophecy. A practical outline looks like this:
- Base case: Range-bound trading around recent weekly structure unless a clear macro or flow catalyst arrives.
- Upside case: Sustained spot demand (for example, persistent ETF net creations) plus easing financial conditions.
- Downside case: Risk-off equities, tighter liquidity, or a leverage cascade that forces forced selling.
For each case, write the invalidation: what evidence would make you discard the story. If you cannot name invalidation, you do not have a thesis—you have a hope.
Writers and analysts should also date their assumptions. An outlook written before a Federal Reserve decision is a different document from one written after the press conference. Update the date; do not quietly recycle last month’s language.
Practical checklist before you quote a number
If you publish, brief a client, or simply decide what “bitcoin price today” means for your own notes, run this checklist:
- Venue and pair labeled (for example, Bitstamp BTCUSD or Coinbase BTC-USD).
- Timestamp in UTC.
- Timeframe noted (1H / 1D / 1W).
- Context sentence: what catalyst, if any, sits in the same window.
- Disclaimer: community discussion is not investment advice.
That discipline keeps “live chart” language honest. A blog can host a snapshot; it cannot host a continuous feed unless you embed a live widget and maintain it.
Where this pillar sits in the cluster
Bitcoin price is the hub keyword because almost every other search—Fed cuts, ETF wrappers, inflation hedges, scam groups, search-interest spikes—eventually returns to the USD print people see on a screen. The spoke articles linked below unpack those adjacent questions without replacing a live chart.
Use the related reading list to go deeper on policy transmission, product wrappers, communications during whipsaws, and beginner definitions. Return here when you need the price-literacy frame again.
FAQ
What is the bitcoin price right now? Any number in a static article is outdated quickly. Open a live exchange quote or a live BTCUSD chart and read the last trade with a timestamp. Treat screenshots as teaching aids, not as current marks.
Why do different sites show different bitcoin usd prices? Venues have different order books, fees, and update lags. Some pages show USD pairs; others show USDT or composite indexes. During fast markets, those differences widen before arbitrage compresses them.
Is a large 24-hour move a buy or sell signal? Not by itself. A large daily move tells you volatility expanded. You still need to know whether leverage flushed, whether spot demand changed, and whether the move fits weekly structure. Percentage headlines are starting points, not conclusions.
Does a Federal Reserve decision set the bitcoin price for the week? No. Policy surprises change liquidity expectations and risk appetite, which can move bitcoin sharply. Markets also reprice after speeches, data prints, and positioning adjustments. One decision is a catalyst window, not a permanent setpoint.
How should beginners watch bitcoin price today without getting overwhelmed? Pick one reputable spot chart, one weekly view, and one macro calendar (Fed dates and major CPI prints). Ignore tip groups that promise guaranteed entries. If you want community discussion of headlines, keep it clearly separated from trading instructions.
Related reading
Join the live room
Want live Bitcoin price alerts and Fed decision flash notes? Use the community page join button—we never post invite links that ask for seed phrases.
Get live signals & updates → WhatsApp / community group
Community updates only. Not investment advice.





0 comments
Be the first to share your thoughts on this post.